Sunny Cha
3月 13, 2018
As the mobile industry evolves, paid advertising remains a cornerstone of any comprehensive growth marketing strategy, and with good reason. Networks and tool providers are constantly innovating to deliver better targeting capabilities and more engaging formats in the hopes of driving down Cost Per Install (CPI) rates. The more high-quality users they can deliver at a predictably low cost, the more ad dollars marketers will allocate.
But the mobile advertising marketplace is competitive. There’s no shortage of demand-side firms willing to do just about anything to sway the hearts, minds, and budgets of marketers trying to optimize their annual spend. In order to make the most of their resources, mobile marketers need data-backed insights that speak to each major network’s objective performance capabilities.
Last week, we published the Ad Monetization Report which illustrates an in-depth portrait of modern mobile ad monetization. This week, we’ve analyzed $1.034 billion in aggregated ad spend from nearly 300 mobile publishers in our growth marketing ecosystem to produce our 2017 ad spending report. We’ve boiled down our findings into six data-backed, actionable insights that any UA or growth marketing professional can use to refine their efforts and build out strategies with confidence.
Top Media Sources by Ad Spend
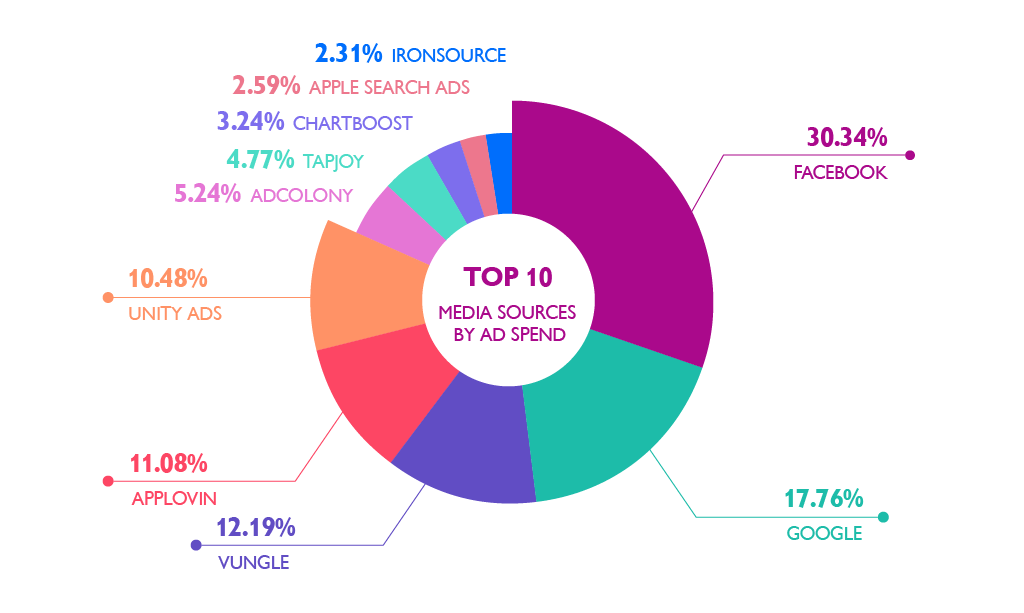
Every mobile marketer needs a high-level understanding of market share. This year, the long-standing duopoly of Facebook and Google remained strong. The two industry giants accounted for nearly half of all reported ad spend, falling just shy of all other top ten networks combined. Marketers also devoted considerable ad spend to some of the most entrenched tier-two networks in the space, including Vungle, AppLovin and Unity Ads.
- Facebook 30.34%
- Google 17.76%
- Vungle 12.19%
- AppLovin 11.08%
- Unity Ads 10.48%
Top Countries By Ad Spend
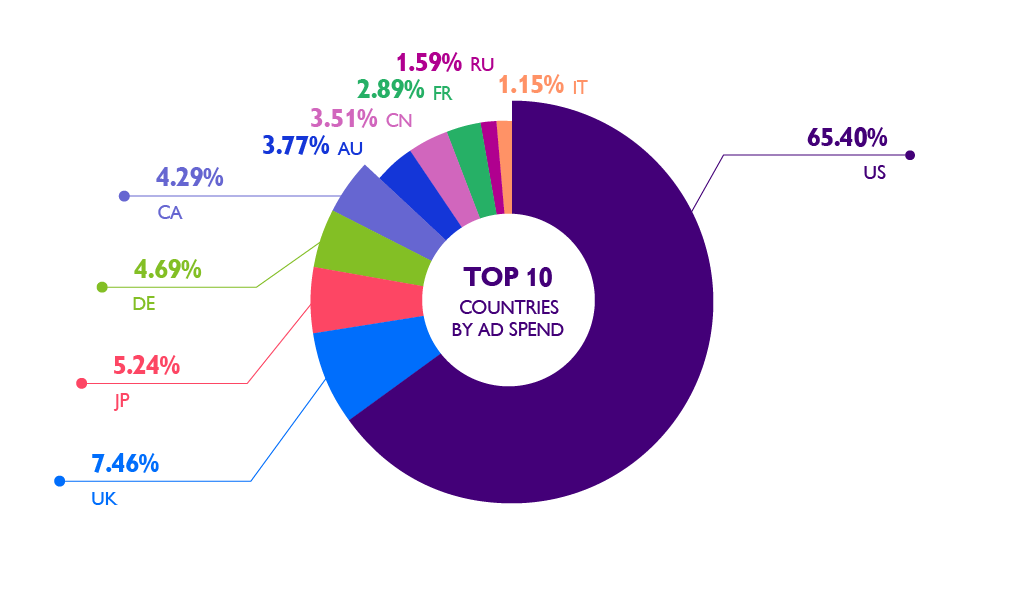
Commanding 65.40% of overall ad spend, the United States remains home to the most sought-after users in the mobile marketplace. Great Britain trails by a sizable margin with 7.46% of overall spend. They’re followed closely by Japan, Germany and Canada, each accounting for roughly 5%. Don’t expect this trend to change anytime soon. Multiple studies have shown that North America has some of the highest IAP spending tendencies in the world, making them the ideal target for mobile app marketers.
- United States 65.40%
- Great Britain 7.46%
- Japan 5.24%
- Germany 4.69%
- Canada 4.29%
Average Cost Per Install On iOS vs Android
While marketers should expect a range of CPI’s across platforms depending on factors like app genre and seasonality, the overall average for CPI’s on both Android and iOS came in just over the $1 mark. It should come as no surprise that iOS installs cost incrementally more than those on Android thanks to their well-documented higher spending behaviors.
- Android $1.08
- iOS $1.30
.png)
Average Cost Per Install Across Major Genres
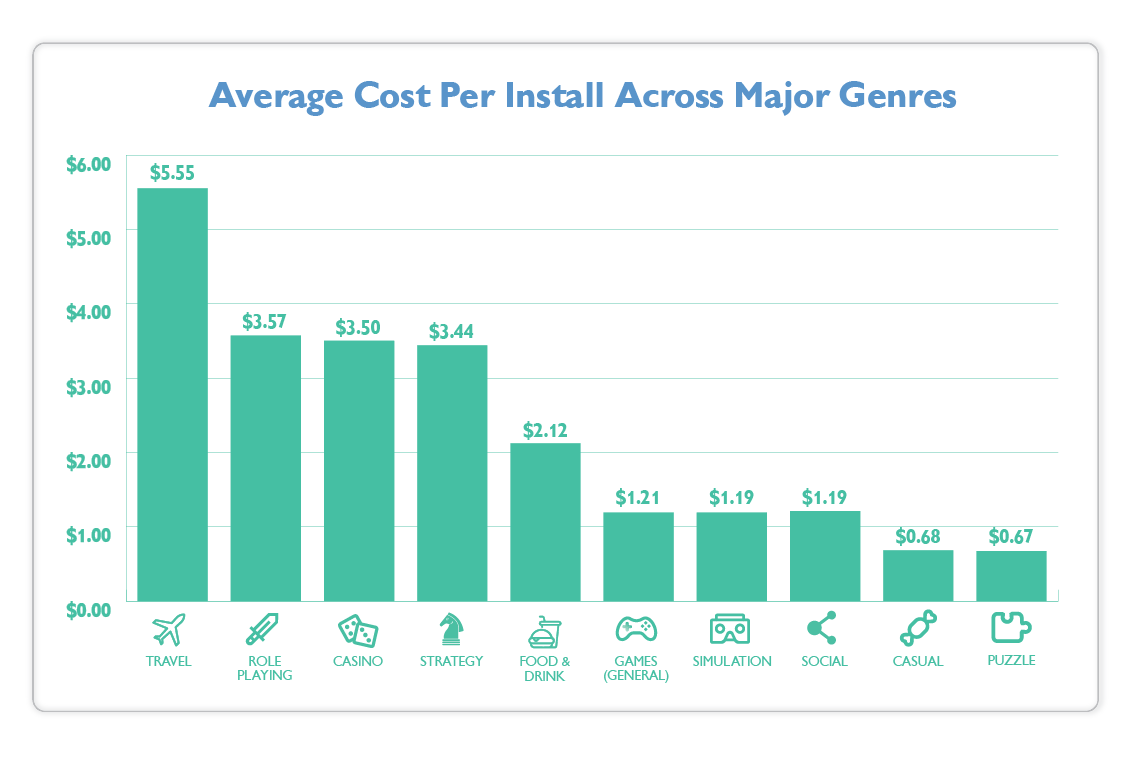
This past year’s spending habits revealed a broad range of install costs across the top 10 genres. Publishers trying to attract high-value users have lead to some intensely competitive marketplaces. Chief among them are travel apps, which is to be expected considering the high LTV that comes with brokering travel deals. Following closely behind were the Role Playing, Casino, and Strategy game genres, almost certainly due to their high revenue ceilings and propensity for producing some of the most valuable mobile user segments in the industry.
- Travel $5.55
- Role Playing (Games) $3.57
- Casino $3.50
- Strategy $3.44
- Food & Drink $2.12
Average Cost Per Install Across The Industry’s Most Popular Ad Networks
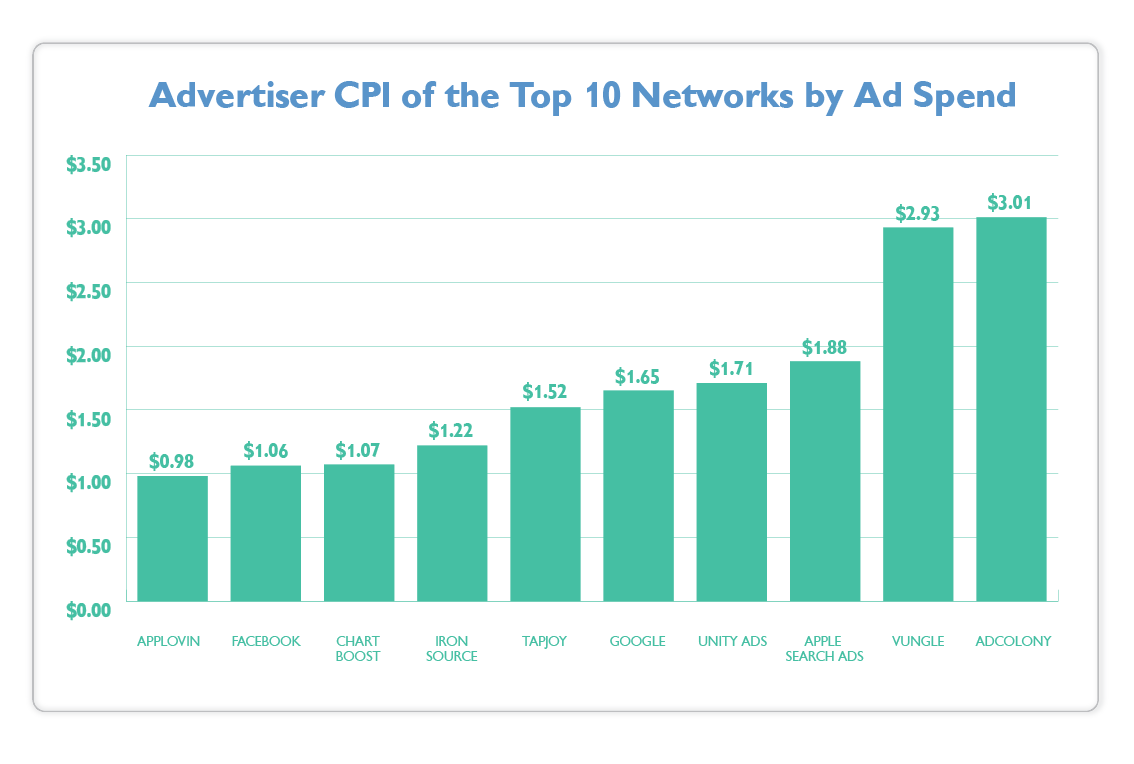
A network’s average CPI speaks to its targeting capabilities and overall efficacy. A lower average CPI suggests the network has a strong handle on user behavior and offers formats that users find compelling. While every network has a different-sized footprint across verticals, it’s important for mobile marketers to consider average CPI’s when choosing which network to trust with their resources. Our data shows that in 2017, AppLovin offered marketers the lowest average CPI, but not by much. Facebook and Chartboost came in 8 cents behind. Combined, the three networks constitute an excellent starting point for marketers looking to establish a strong base for their UA initiatives.
- AppLovin $0.98
- Facebook $1.06
- Chartboost $1.07
- ironSource $1.22
- Tapjoy $1.52
Average Cost Per Install By Country
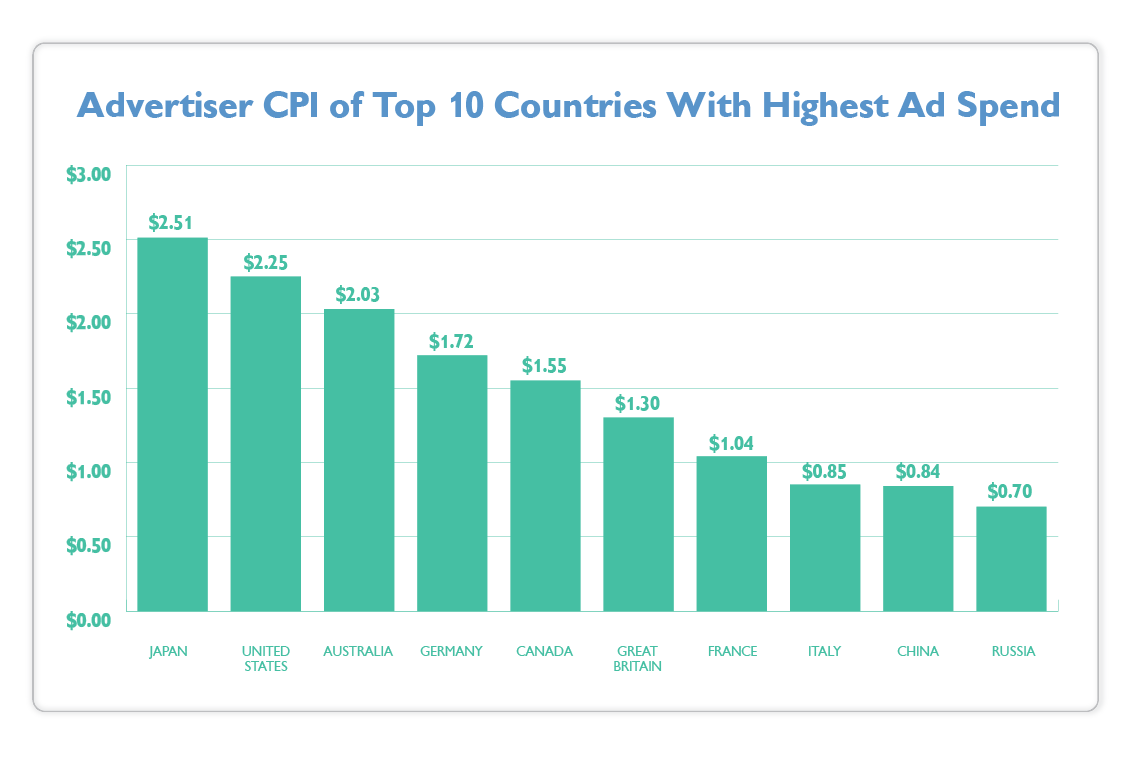
Knowing average CPI’s across multiple countries is key to forecasting ROI on localization and other global publishing initiatives. Across the Tenjin ecosystem, Japanese users came in as being the most expensive, beating out US users by just under 25 cents per install. Australia, Germany and Canada were next in line, each roughly following a 25 cent incremental decrease in cost. Keep these numbers handy when planning your next soft-launch to ensure you’ve set aside sufficient resources to reach the critical mass needed to optimize your app design.
- Japan $2.51
- United States $2.25
- Australia $2.03
- Germany $1.72
- Canada $1.55
Over the past decade, we’ve seen the mobile advertising industry undergo significant changes. New formats, market consolidation, and emerging best-practices continue to keep marketers on their toes. The more objective, data-driven insight that can applied to your growth strategies, the better. Whether you’re planning a soft launch, burst campaign, or simply looking to scale your day-to-day growth operations, we hope these insights will help you make decisions with confidence.
