Sunny Cha
1月 24, 2019
We analyzed $1.04 billion of mobile ad spend data from the Tenjin platform to determine which networks and genres are leading the pack in terms of popularity and cost-effectiveness.
2018 was a year that simultaneously rushed past us yet felt much longer than expected. So much has happened in a brief twelve months — especially within the mobile marketing space — that something like our Snapchat Mobile Measurement Partnership feels like a distant memory!
Now that we’ve comfortably settled into a new year, it’s important to take a look back at 2018 to summarize its impact on our industry. To that end, we analyzed a sample of last year’s ad spend data from the Tenjin platform and summarized its biggest lessons as actionable insights. We learned that mobile ad spending is on the rise, CPIs are at historic lows, and discovered answers to the following crucial questions:
- What are the Top 20 mobile gaming genres by ad spend, and what is their average CPI?
- Which countries have become more cost effective for mobile publishers since 2017?
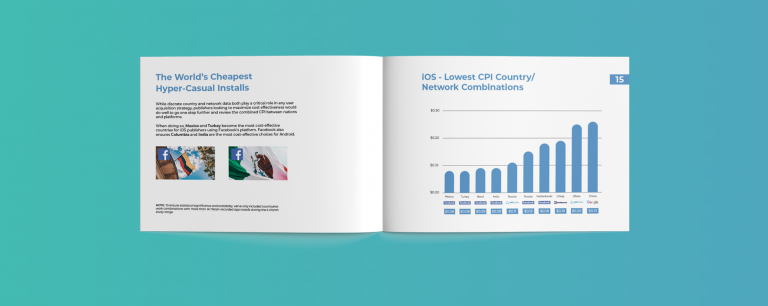
- Are there any high-performing ad networks with a lower CPI than Facebook or Google?
These are just a few insights that will help publishers and marketers make better spending decisions and develop their brands during 2019.


