Sunny Cha
3月 8, 2018
As mobile innovation drives ahead, in-app advertising remains a staple of monetization. There are plenty of options available for publishers looking to implement basic solutions, but in order to realize the maximum potential ad revenue, monetization managers need to keep up with market trends. In the rapidly evolving world of mobile ad monetization, this is easier said than done.
In recent years, we’ve seen casual game/app publishers come to rely on ad placements to compensate for lower retention and conversion. Many midcore publishers now depend on rewarded ad placements to fuel their in-app economies. Even some hardcore publishers that initially abstained from ads altogether are starting to experiment with ads for their well-retained, non-converted user segments. Each approach has had its own merits and challenges, and deciding which strategy is right for your business requires a solid understanding of the nuance and subtleties inherent to each.
With that in mind, we’ve analyzed more than $300,000,000 in ad revenue generated by more than 1,400 apps to provide an in-depth portrait of modern mobile ad monetization. After a rigorous analysis, we’ve distilled our findings into six key, high-level insights that every mobile monetization manager can use to effectively optimize their portfolio for the years ahead.
Which Networks Are Generating The Most Ad Revenue For Publishers?
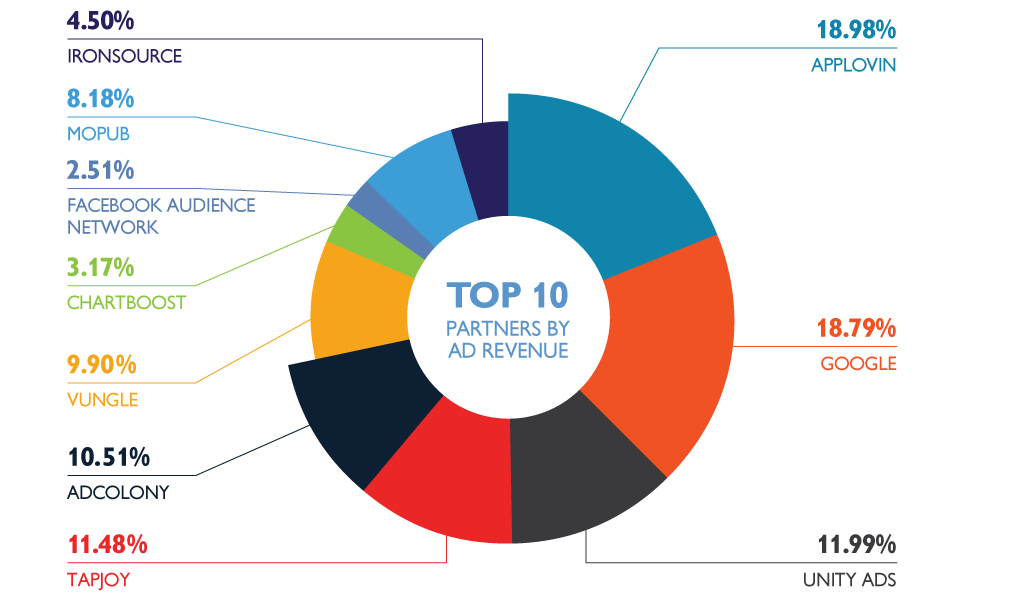
Publishers have no shortage of options when it comes to monetizing users through in-app advertising. All the major networks continued to innovate their products this year, exploring new formats like rich media while doubling down on effective targeting practices. On the heels of their acquisition-turned-financing deal with Orient Hontai Capital, AppLovin remains the top choice for mobile publishers, generating 18.98% of our recorded ad revenue. Trailing them are Google, Unity Ads, Tapjoy, and Adcolony, all commanding similarly sized portions of the ad monetization market share.
- AppLovin – 18.98%
- Google – 18.79%
- Unity Ads 11.99%
- Tapjoy – 11.48%
- AdColony – 10.51%
Which Country’s Impressions Are Generating The Most Ad Revenue For Publishers?
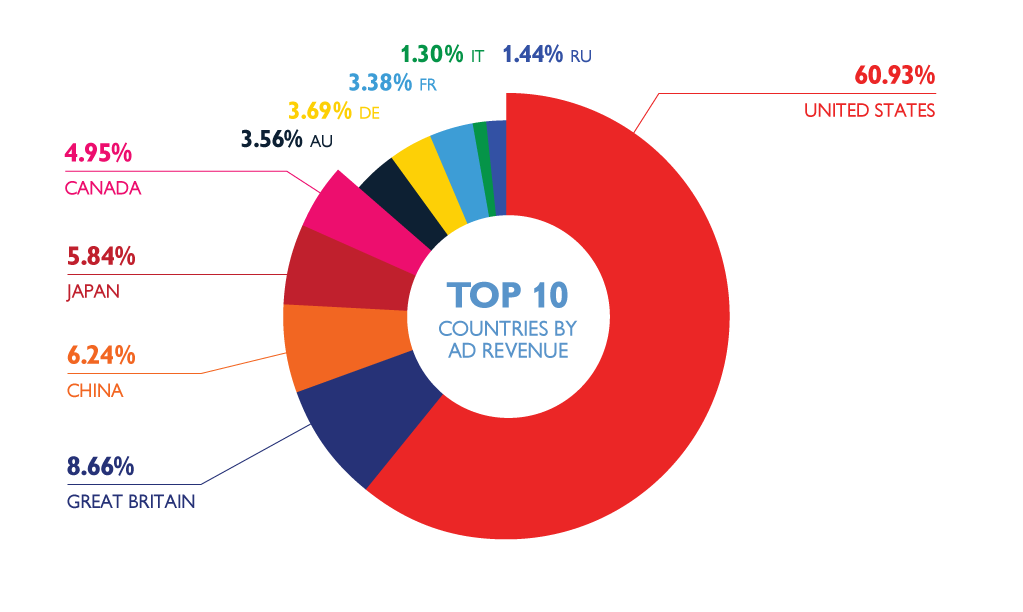
With the vast majority of in-app spending originating in the United States, it should come as no surprise that ad impressions shown to US users are generating the vast majority of revenue for publishers. At a whopping 60.93%, US impressions account for more than the next 9 countries combined. The UK, Canada, and Japan account for noteworthy percentages of total revenue tracked. Overall, publishers can safely plan to prioritize the US above all other countries when planning their ad monetization initiatives.
- United States 60.93%
- Great Britain 8.66%
- China 6.24%
- Japan 5.84%
- Canada 4.95%
Which Networks Generate The Highest eCPMs For Publishers?
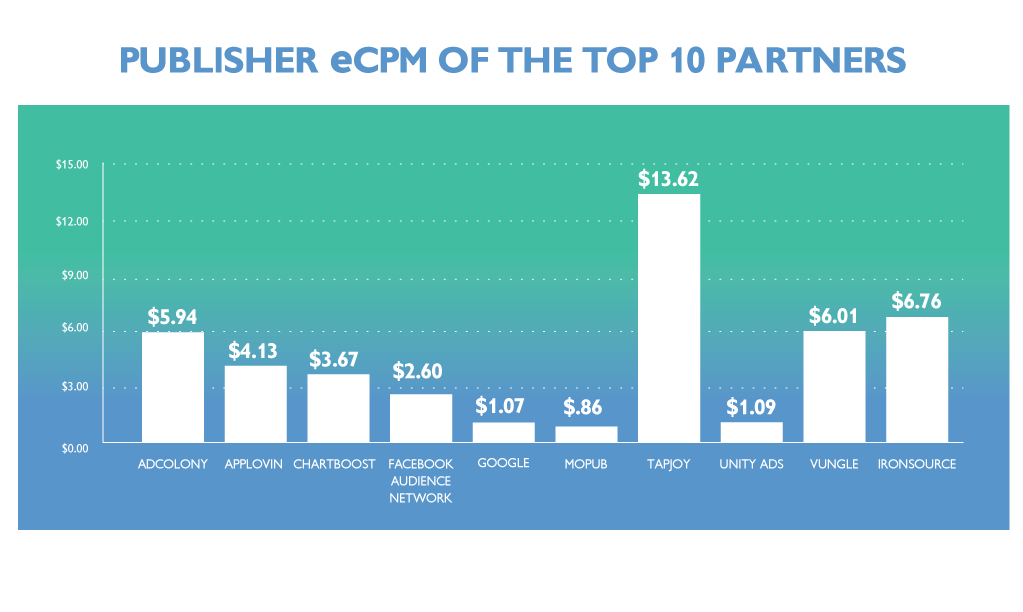
A strong fill-rate is integral to forecasting and scaling any ad monetization initiative, but experienced professionals will tell you that it’s far from the only relevant variable. A network’s average eCPM across geos is equally important, especially for publishers with global audiences. Our data found Tapjoy, ironSource, Vungle, and AdColony to be strong front-runners when it comes to average eCPM. It’s worth noting, however, that this report aggregates data across multiple formats, including offer walls and direct deals, resulting in higher eCPMs among networks like Tapjoy that offer them.
- Tapjoy $13.62
- ironSource-Publisher $6.76
- Vungle $6.01
- AdColony $5.94
- AppLovin $4.13
Which Platform Users Generate The Highest eCPMs?
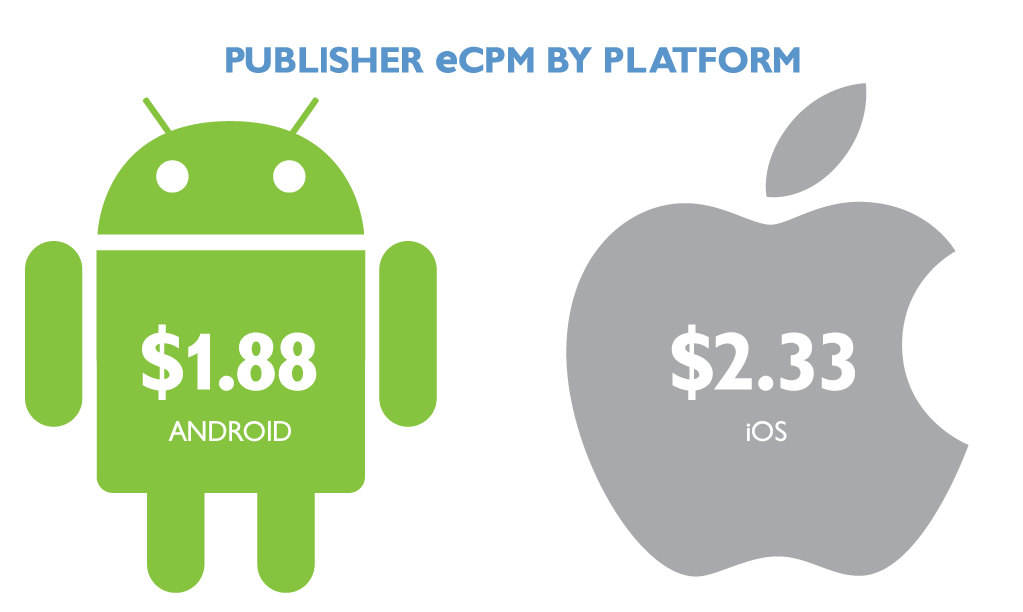
Experienced publishers know that not all users are created equal. Aggregate behavioral data for users across Android and iOS suggest two unique profiles, each requiring their own special approach. Though overall market share is skewed vastly in favor of Android, iOS users spend up to 2.5x more on in-app purchases. As a result, publishers are able to generate 20% higher eCPMs from ad impressions on iOS than they are on Android.
- iOS $2.33
- Android $1.88
Which Country’s Impressions Generate The Highest eCPMs For App Publishers?
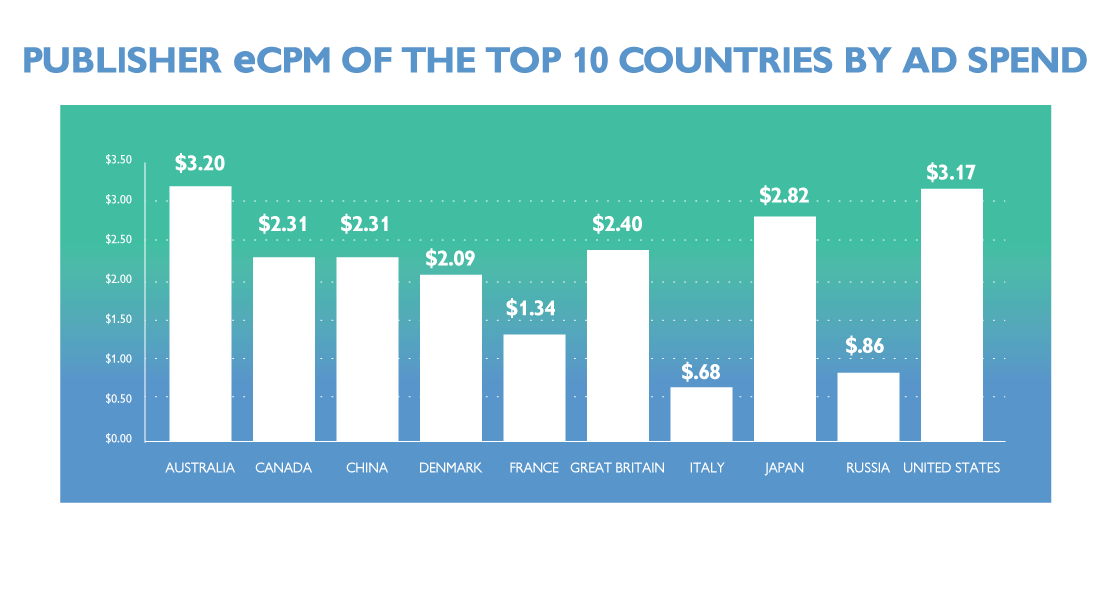
Knowing what sort of eCPM to expect from impressions in any specific geo can be a huge advantage when forecasting revenue for your app portfolio. Our data suggests that average eCPMs across all formats are highest in Australia in the US, followed closely by Japan and the UK. Casual game publishers, or anyone else that develops titles that rely heavily on in-app ad revenue, would be well-served to soft launch their titles in Australia before going live in the US.
- Australia $3.20
- United States $3.17
- Japan $2.82
- Great Britain $2.40
- Canada $2.31
Which App Genres Produce The Highest eCPMs For Publishers?
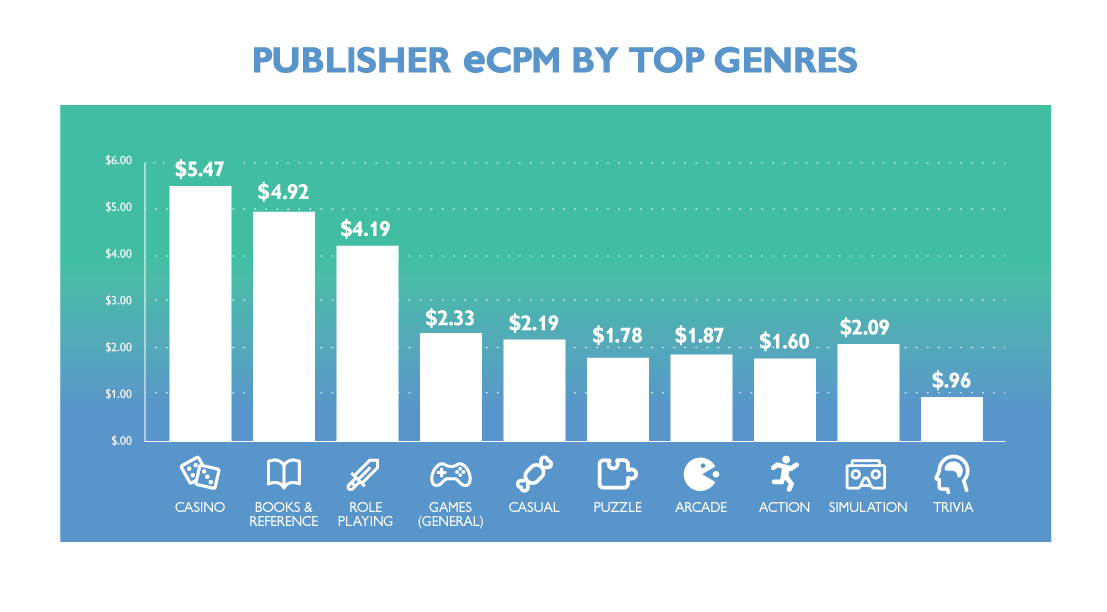
Aligning audience interest with ad content is the best way to ensure a high eCPM, but it’s also helpful to know which genres generate the highest revenue per impression. The genres most often associated with high spending behaviors are the ones generating the most revenue for publishers. Casino apps come in at the top of the list, followed shortly by Books & Reference apps and Role Playing games. Keep these figures in mind the next time you’re brokering a direct deal or browsing an exchange.
- Casino $5.47
- Books & Reference $4.92
- Role Playing $4.19
- Games (General) $2.33
- Casual $2.19
At Tenjin, we work closely with ad monetization managers from publishers of all sizes. Doing so has allowed us to intimately understand the importance of actionable, data-driven insight when it comes to unlocking an app portfolio’s full potential. Trends related to geography, genre, platform and network all play pivotal roles in the development of a strategy that works. We hope these insights will help inform your ad monetization strategy going ahead, putting you and your team well ahead of the curve.
To learn more about how Tenjin’s growth data infrastructure can help you maximize ad revenue, get in touch us at sales@tenjin.io.


